Core Web Vitals 2026: a practical optimisation guide
LCP, INP and CLS explained simply, with what changed in 2026 and concrete strategies to make your site faster and more stable.
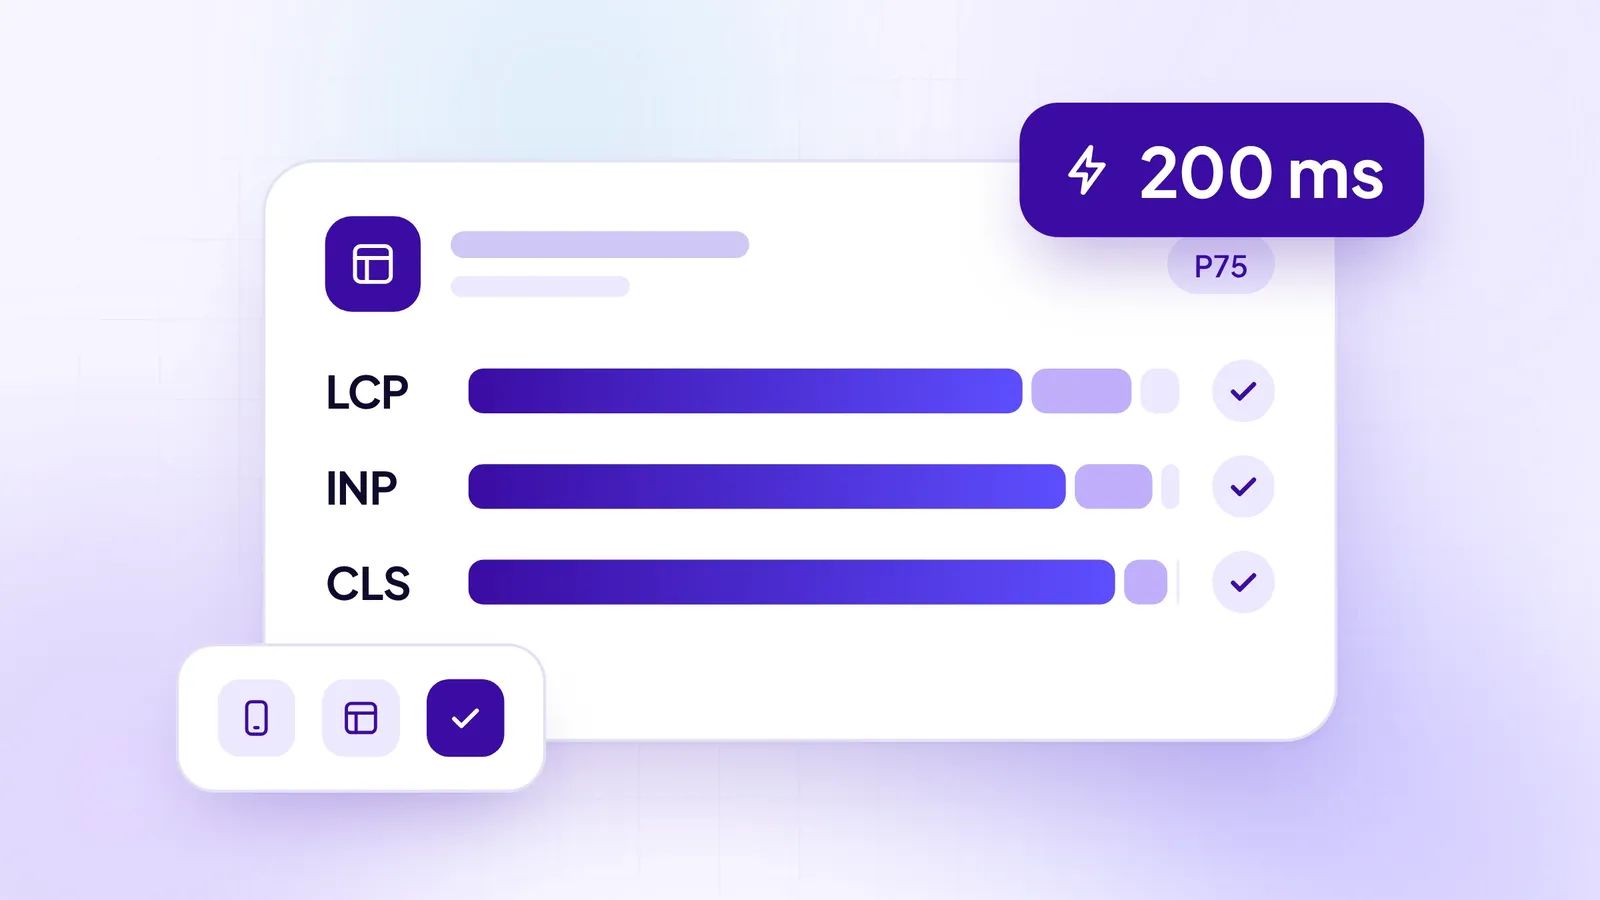
Since 2021 Google has used the Core Web Vitals as a ranking signal within "page experience". There are three metrics and the thresholds have not changed: what changed in 2026 is mostly how they are measured. Here is what they measure, what is new and how to improve them in practice.
The three core metrics
LCP — Largest Contentful Paint
Measures how long it takes for the largest visible element on the page (usually the main image or a block of text) to be displayed. Target: within 2.5 seconds. Between 2.5 and 4 seconds "needs improvement"; beyond that is "poor".
INP — Interaction to Next Paint
It replaced FID in March 2024. It measures responsiveness: how long passes between an interaction (click, tap, typing) and the moment the page shows a visual response. Target: within 200 milliseconds. Unlike FID, it considers every interaction during the visit, not just the first.
CLS — Cumulative Layout Shift
Measures visual stability: how much elements move while the page loads. Text that jumps, buttons that move just as you are about to tap them. Target: below 0.1.
To pass the assessment, Google looks at the 75th percentile of real visits: at least three visits in four must stay within the threshold, separately on mobile and on desktop.
What changes in 2026
The main news concerns sites built as single-page applications (React, Vue, Angular and the like). Until now, when you changed page without reloading the document, the browser kept attributing the metrics to the first URL. Since Chrome 151, released in August 2026, these "soft navigations" are measured by default: every page change gets its own LCP, INP and CLS.
Two caveats. Google has not yet decided how these measurements will feed into the Chrome UX Report, the dataset behind PageSpeed Insights and Search Console. And the thresholds are the same as ever: articles are circulating about LCP being "lowered to 2 seconds" or about "domain-level" scoring, but Google's official documentation says nothing of the kind.
The most common causes of a high LCP
- A heavy main image, or one without fetchpriority="high"
- A main image that is lazy-loaded: avoid it above the fold
- Fonts loaded from external services in a blocking way
- High TTFB: a slow server, no caching, no CDN
- Render-blocking CSS and JavaScript in the <head>
- JPEG or PNG images where WebP or AVIF would weigh far less
How to improve LCP
The most effective fix is almost always the main image: a modern format (WebP or AVIF), sizes that fit the screen via srcset, fetchpriority="high" and no lazy loading. If the image is set in CSS, a <link rel="preload"> in the <head> lets the browser discover it straight away.
Second priority: the server. A page that arrives after 1.5 seconds has already used more than half of the budget. Page caching, compression and a CDN reduce TTFB more than any front-end optimisation. Finally, hosting fonts on your own domain removes an external connection, which is particularly costly on mobile networks.
How to improve INP
INP is often the hardest metric, because it depends on how much JavaScript the browser runs on the main thread. The strategies that work:
- Cut third-party scripts (chat, widgets, advertising pixels) and load them only where they are needed
- Break up long tasks, handing control back to the browser with scheduler.yield() where supported and setTimeout as a fallback
- Show visual feedback for the interaction immediately and defer the heavy work
- Load non-critical scripts with defer or async
- Avoid huge DOMs: pages with thousands of nodes make every update slow
How to improve CLS
CLS is usually the easiest to fix. Most problems come from:
- Images and videos without width and height: the browser does not reserve the space
- Web fonts that change the size of the text as they load: font-display: swap helps, but removing the shift takes a fallback font with similar metrics (size-adjust)
- Banners, ads and widgets inserted without reserved space
- Content added dynamically above what is already visible
In an audit of a client's site we brought CLS down from 0.42 to 0.02 simply by adding explicit width and height to every image and fixing how the fonts were loaded.
Tools for measuring
PageSpeed Insights is still the place to start, but it shows two different things: lab data (a simulation) and real data from Chrome users over the last 28 days. Google's assessment uses the latter. The Core Web Vitals report in Search Console groups pages with similar problems, and the Performance panel in Chrome DevTools is essential for finding which interaction causes a high INP. For continuous monitoring, the web-vitals library collects the metrics directly from real users.
Conclusion
The Core Web Vitals are not just ranking metrics: they are an indicator of the real experience of the people visiting your site. A fast, stable site converts better and keeps visitors longer. And optimisation is not a one-off job: it needs watching over time, especially after every release or content update.